Photometric Calculator
Table of Contents
Photometric Calculator
This photometric calculator is free to use — no account, no password. It runs entirely in your browser; enter your name and email to reveal your result, and we can send you a copy.
This photometric calculator answers the question a lighting layout eventually comes down to: how much light actually lands on a specific point on the floor from one luminaire mounted at a known height? Enter the lamp's luminous flux, pick or type a candela distribution, set the mounting height and the horizontal offset to the target, and it returns the illuminance directly below the fitting, the illuminance at the marked point, and the beam spread.
It works in metric lux or imperial footcandles, and the result updates live as any input changes. Lamp output can be entered as lumens directly, or derived from wattage and efficacy — useful when a datasheet quotes power and lm/W but not total flux.
How the Photometric Calculation Works
The method is the point-by-point calculation, and it rests on two pieces of physics. The inverse square law says illuminance falls with the square of the distance from the source. The cosine law says a surface tilted away from the light receives less of it, in proportion to the cosine of the incidence angle.
Combine them for a horizontal surface, with θ measured from straight down and h the mounting height above that surface:
E = I × cos³θ / h²
The cube looks surprising until you unpack it. The straight distance to the target is d = h / cosθ so the inverse square term contributes cos²θ and the cosine law contributes one more. That single exponent is why illuminance drops away from directly below a fitting far faster than most people expect.
The other half of the calculation is I, the luminous intensity in candelas in the direction of the target. That comes from the distribution curve, which manufacturers publish per 1000 lumens so one curve serves every lamp offered in the same housing:
I = (candelas per 1000 lm at θ) × (total lumens / 1000)
So the calculator does three things in sequence: work out the angle from the geometry, read the intensity at that angle off the distribution, then apply inverse square and cosine to get lux at the point.
Reading a Polar Intensity Diagram
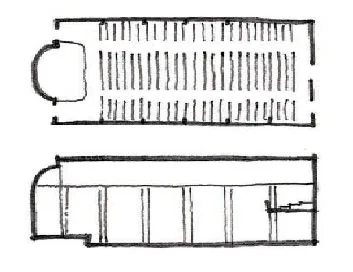
The polar diagram is the fixture's fingerprint: how much intensity it sends in each direction, in candelas per 1000 lumens. A narrow spot concentrates a very high value in a few degrees around nadir and collapses to almost nothing by 30°. A wide diffuser spreads a much lower peak across a broad arc. Two fittings with identical lumen output and identical wattage can differ by a factor of ten in the lux they deliver to one point, purely on distribution.
In this photometric calculator the curve is editable. Presets cover the common shapes, dragging inside the polar web picks an angle and reads its value, and the intensity table takes numbers typed straight off a manufacturer's photometric sheet. The beam spread figure reports the angle at which intensity has fallen to half its peak — the same convention as the quoted beam angle on a datasheet, which makes it a quick sanity check that the curve was entered correctly.
Getting the distribution right matters more than getting the lumens right. Lumen output scales the whole answer linearly; distribution changes its shape, and the shape is what determines uniformity, glare and whether a task actually gets the light it needs.
A Worked Photometric Example
Take a 4000 lm downlight on a 3 m ceiling over a work plane 0.75 m above the floor, so the mounting height above the plane is 2.25 m. Suppose the distribution reads 300 cd per 1000 lm at nadir, giving I = 300 × 4 = 1200 cd straight down.
Directly below, θ = 0 and cosθ = 1, so E = 1200 / 2.25² = 237 lux.
Now move 1.5 m sideways. The angle is arctan(1.5 / 2.25) = 33.7° and cos³ of that is 0.576. If the curve gives 220 cd/klm at 33.7° then I = 880 cd and E = 880 × 0.576 / 2.25² = 100 lux. The same fitting, 1.5 m away, delivers well under half the light — and that fall-off, not the headline lumen figure, is what decides the spacing between fittings.
Change one thing again: raise the ceiling to 4 m, keeping everything else. The nadir figure becomes 1200 / 3.25² = 114 lux, less than half of the 3 m case, because the height term is squared. Mounting height is the most powerful single number in a lighting layout, which is why lighting design settles it before fixture selection rather than after.
Photometric Calculator or Lumen Method?

These are two different questions, and the pair of tools on this page answers one each. The Lumen Method calculator is a whole-room average: total flux needed for a target illuminance across a space, adjusted for utilisation and maintenance factors. It answers "roughly how many fittings does this room need?"
A photometric calculator answers the opposite, narrower question: "what does this one fitting deliver there?" It ignores the room entirely — no walls, no reflectance, no averaging — and gives a direct-component figure for a single point.
In practice they sit at different moments. The lumen method sizes the scheme and the budget. Point-by-point checks the hard cases the average hides: the desk in the corner, the lectern the average says is fine, the display case, the stair nosing, the sports pitch where uniformity between measurement points is the specification. Where the two disagree, they are usually both right about different things.
Where a Photometric Calculator Stops
This photometric calculator computes the direct component from a single luminaire treated as a point source. Each of those three words is a limit worth knowing.
Direct means no interreflection. In a room with pale walls, light bouncing off surfaces adds a meaningful fraction of what a work plane actually receives, and none of it appears here — that contribution is exactly what the lumen method's utilisation factor exists to estimate.
Single means real installations need each fitting computed and the results summed. Illuminance from multiple sources adds, so a point sitting under two fittings receives both contributions.
Point source means the maths assumes the fitting is small relative to its throw. The usual rule of thumb is a distance of at least five times the luminaire's largest dimension — so it holds for a downlight over a desk, and breaks for a long linear fitting close to a wall.
Preset curves are also generic by design. Once real products are chosen, the numbers should come from the manufacturer's own photometric file, and any scheme being issued for construction belongs in full photometric software where geometry, reflectance, daylight and glare are modelled together. ALTA Integra runs this check at concept stage and then replaces it with a full model before a lighting design is signed off. The underlying relationship is set out in this reference on the inverse square law.
Related Photometric Calculator Insights and Project Work
Further photometric calculator material from ALTA Integra, related technical insights, and the built projects where this engineering was applied.
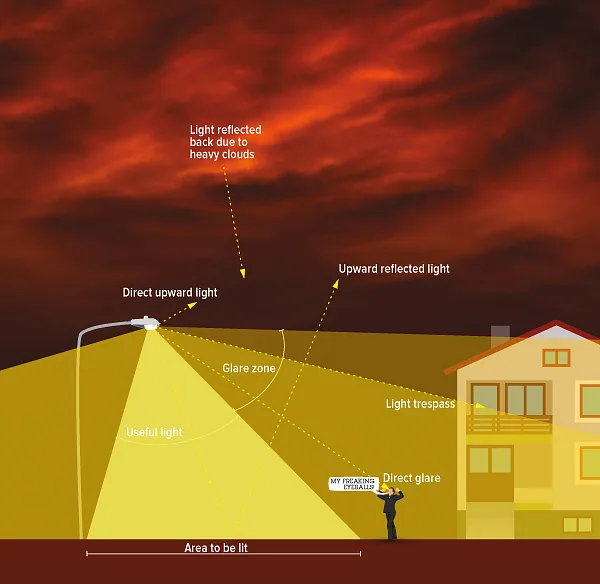 Insight: Outdoor Lighting Without Light Pollution: Four Components and How to Design Them Out — Aiming and intensity distribution decide how much light lands where it was never wanted.
- Insight: Hotel and Apartment Design: Why Acoustics, Lighting and Thermal Performance Interact More Here Than Anywhere — Guest-room and corridor illuminance, checked point by point rather than as a room average.
 Insight: Classroom Acoustics and Daylighting: Designing Schools Around How Learning Actually Happens — Task illuminance on the desk, not the room average, is what a student reads by.
- Insight: ALTA Integra Wins the Mandiri University Design Competition for Acoustics, Lighting and AV — Three disciplines awarded to one consultant on a single campus.
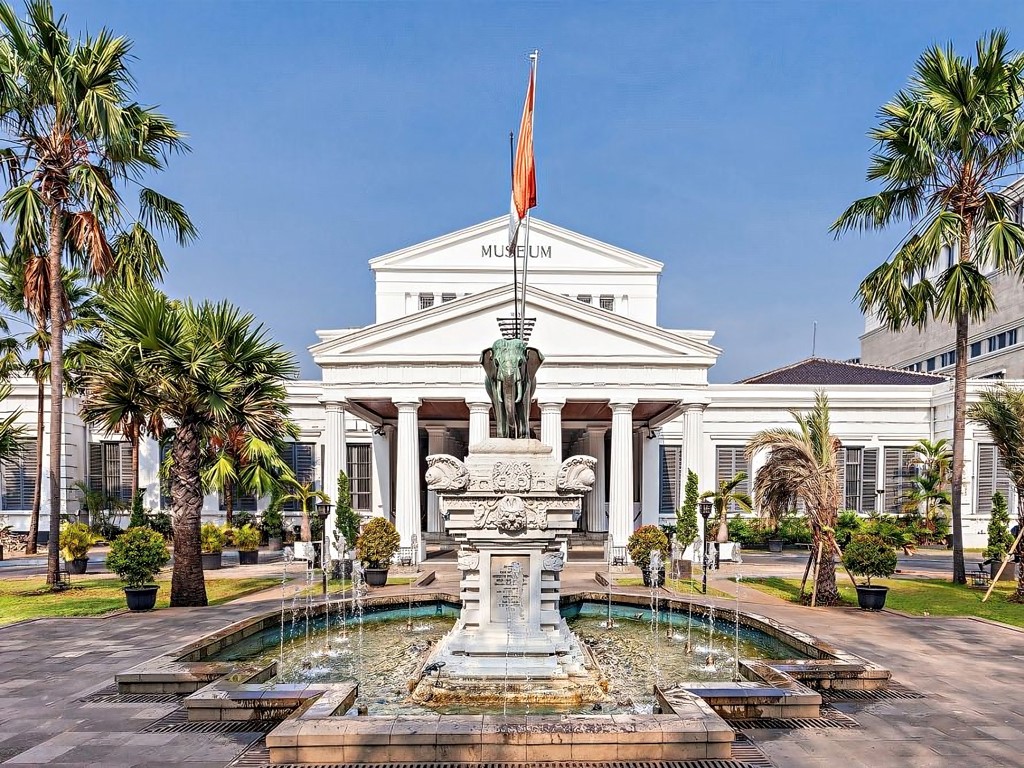 Project: Museum Nasional Indonesia — Conservation-sensitive lighting where illuminance on each exhibit is a hard limit, not a target.
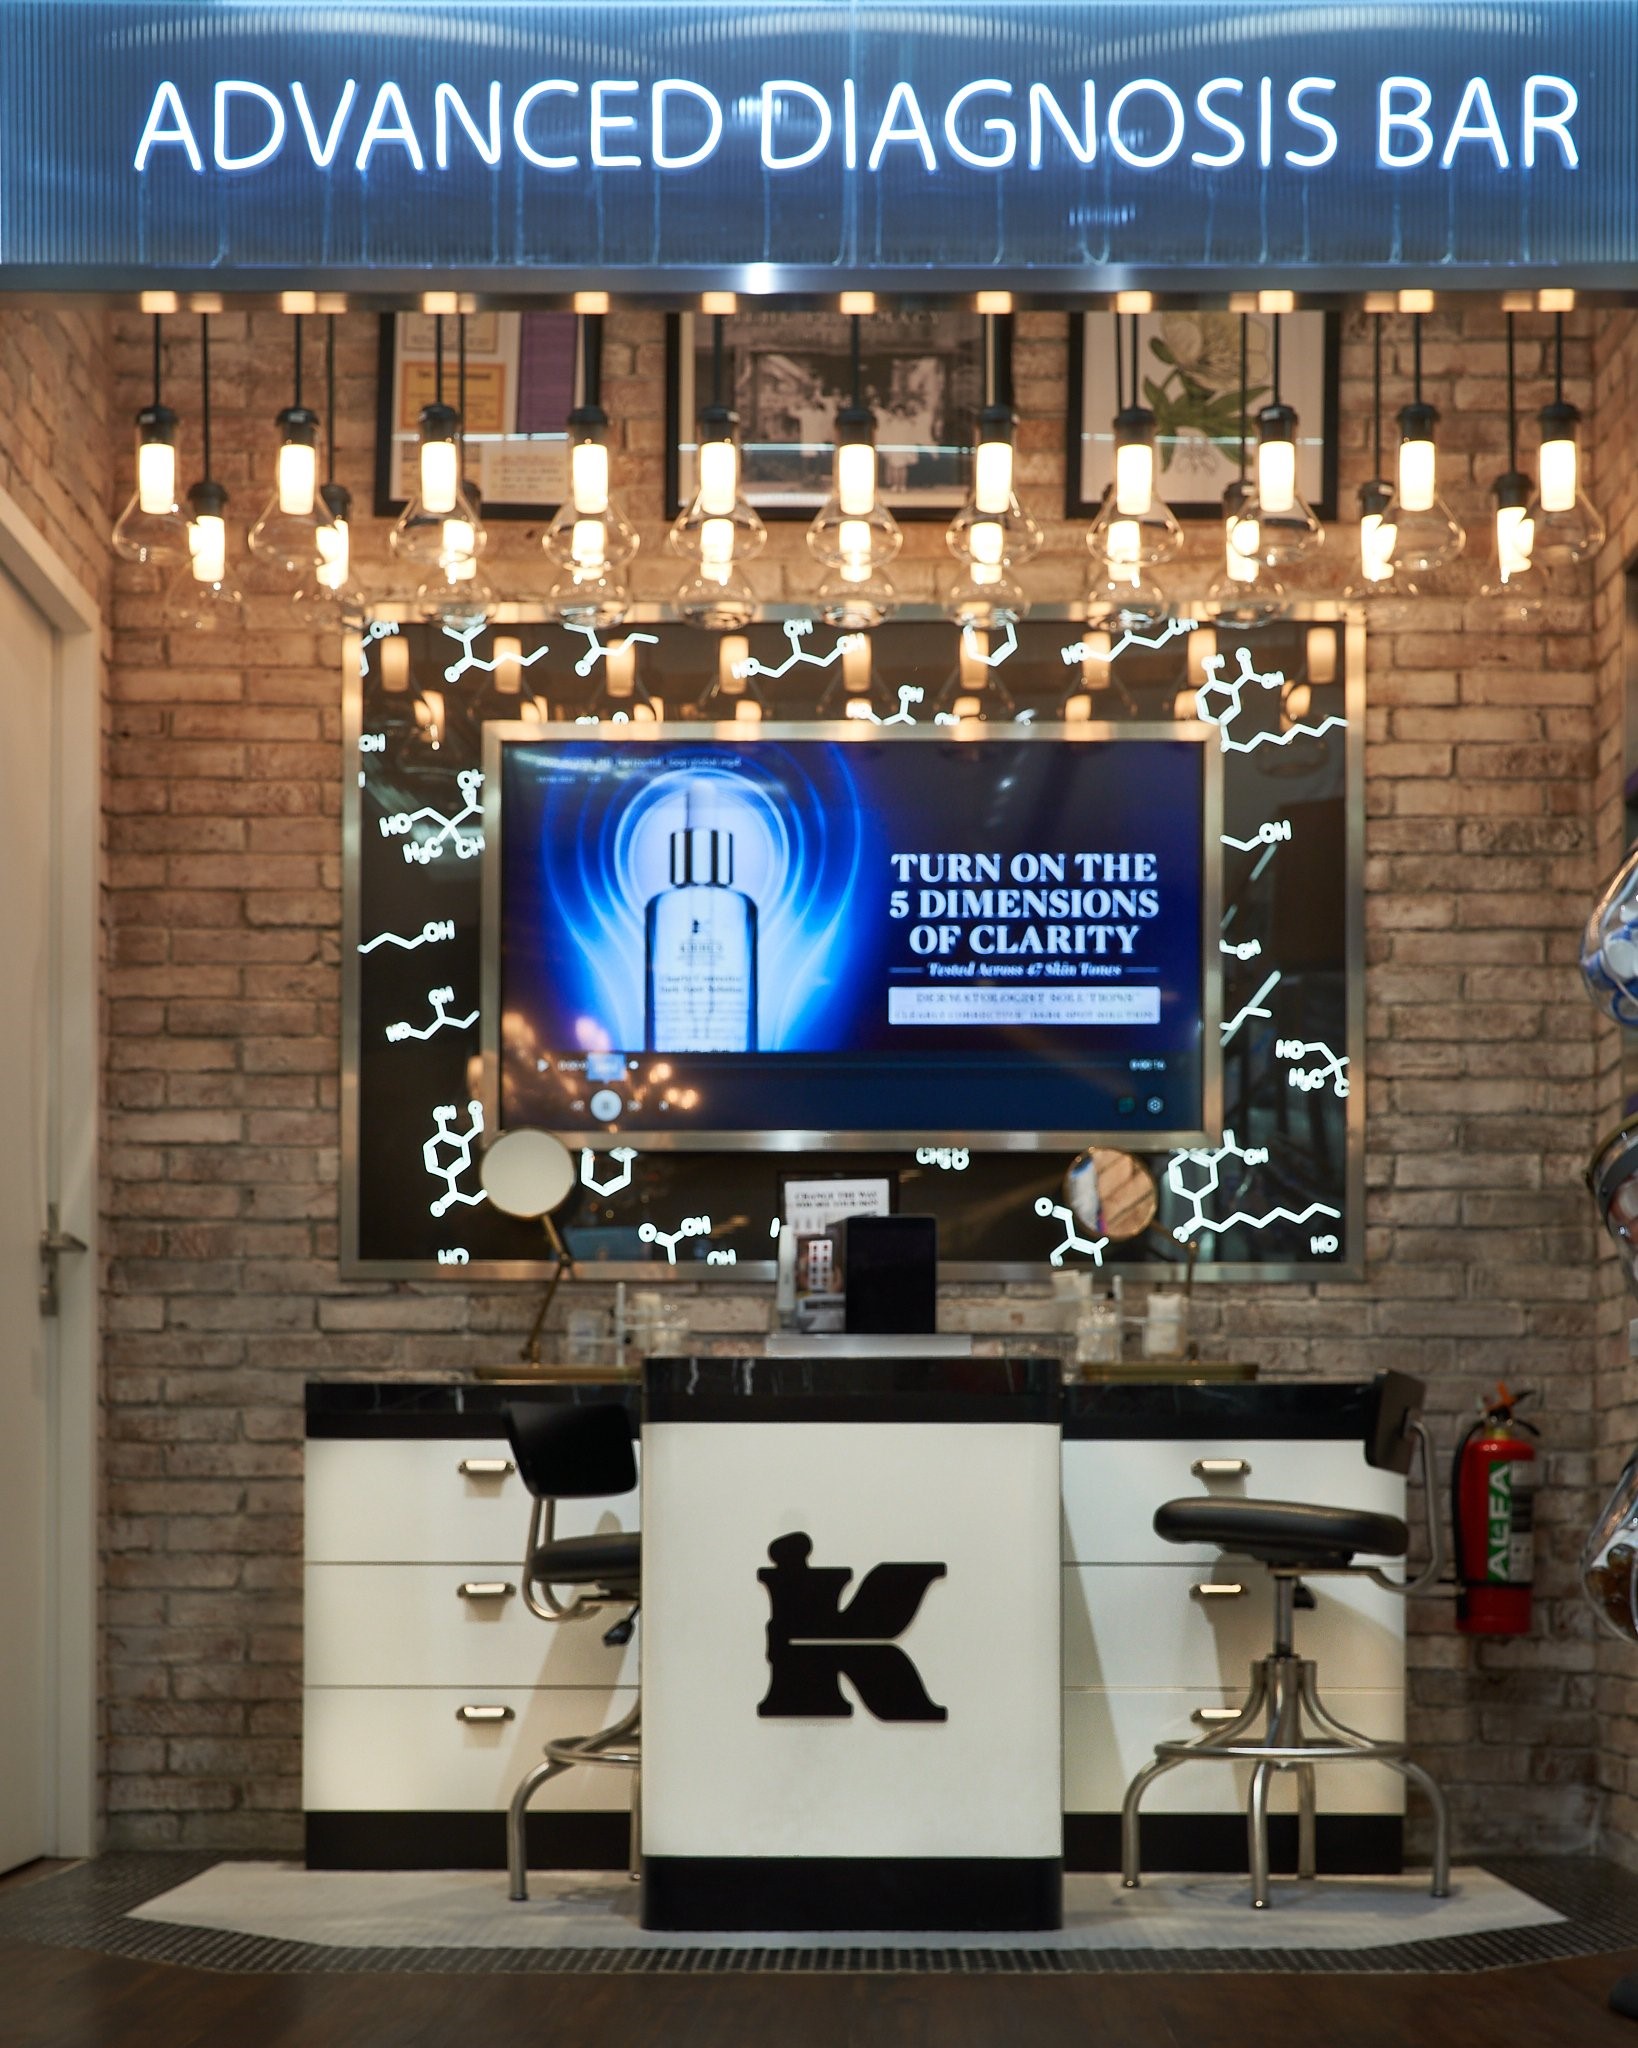 Project: Kiehl's, Central Park Jakarta — Retail lighting where accent-to-ambient ratios are set fitting by fitting.
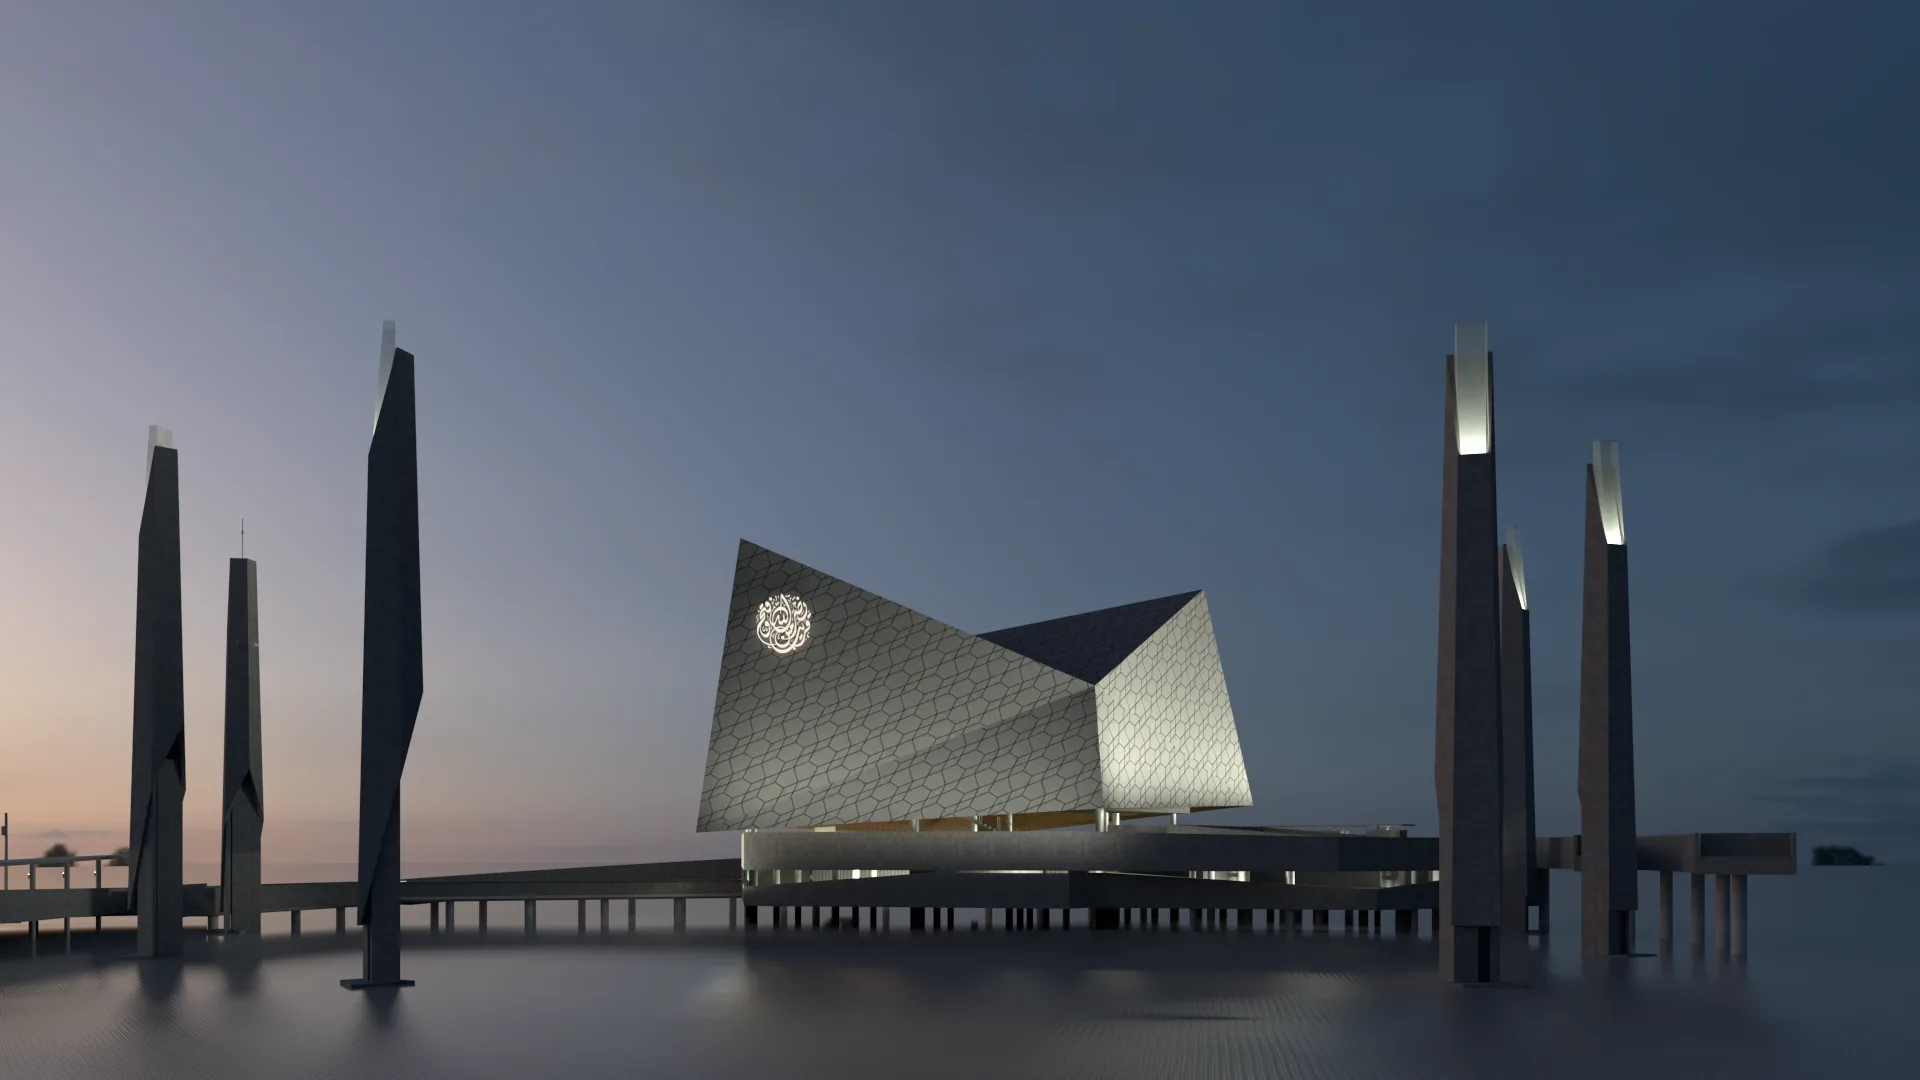 Project: Floating Mosque Ancol (Masjid Apung) — Soft diffused light with focused accents, calm and contemplative on water.