Lesson 3
Noise Criteria: A Background Noise Rating Standard
In the previous lesson, we have learned that we can measure the sound pressure level (SPL) of background noise in dB. You also remember that the SPL value can vary in frequencies. From here, you may wonder why we don’t use a single number rating that can represent the noise level within a range of frequencies. Don’t worry! In the acoustic community, we have noise criteria (NC) to express this single number. And to be honest, we use it quite often. We also have the overall the A-weighted equivalent sound pressure level (LAeq, overall) that is quantified in dBA. Keep reading to know the difference between both of them.
What is Noise Criteria?
Noise criteria (NC) is a building standard that uses a single index to describe the noise level in a given space within a frequency range.
NC was developed by MEP (mechanical, electrical, & plumbing) engineers, together with other building professionals and acoustic engineers in the American National Standards Institute (ANSI).
A single NC number represents one unique curve that spans over the range of octave band center frequencies from 63 Hz to 8,000 Hz.
See Figure 1 for the example. Did you notice something familiar about these curves? Yes, you are correct. They almost mimic the equal-loudness contours we have previously introduced in Lesson 1. These NC curves indeed simplified those contours.
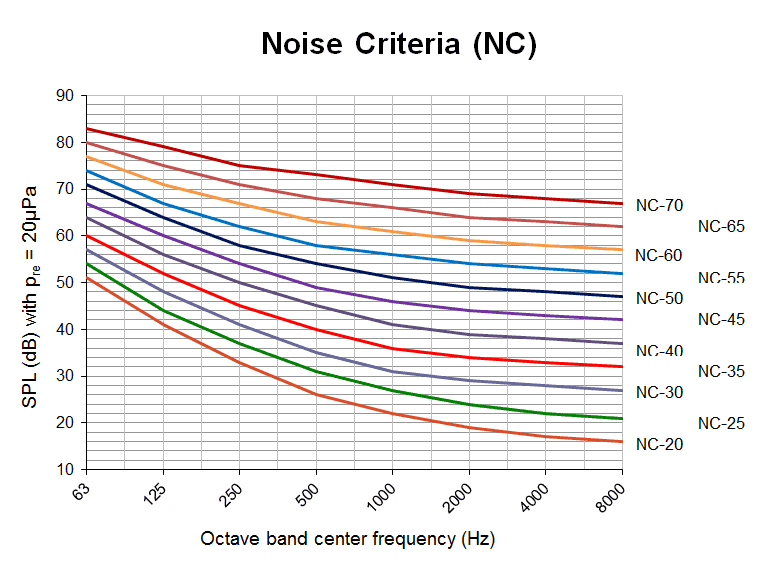 Figure 1. NC graph
How can we convert the measured background noise in dB to Noise Criteria (NC)?
Suppose you have background noise measurement results as shown in Table 1. As you have to measure the noise in a particular period of time and average out over time, we call this SPL value as the equivalent SPL (Leq). Then, plot all these values into an NC graph as depicted in Figure 2. For great visualization, you can connect the measurement results with a line. Here, we use a black line.
Table 1. Background Noise Measurement
Now, it’s time to determine what NC number that is the most representative for that background noise. Here, the lowest NC curve that does not cross the black line should be chosen to get the closest NC number.
From the example, you can see that the line’s peak crosses the NC 40 curve and lies between the NC 40 and NC 45 curve. So here, we can conclude that the measurement result is NC 45. If you have a complete graph, you can have a lower NC number, which in this case is NC 41. However, if you don’t, like what we have today, you can play with some approximation.
 Figure 2. Leq plotting example
One of the benefits of NC is that you can compare whether the background noise you measure in a particular place exceeds the recommended NC. Different countries have different standards about maximum noise levels. Therefore, it is recommended to know about the local regulation where your project takes place.
You may find in some standards that the maximum noise level is not quantified with NC, but in dB(A) or sometimes dBA. What is it? Keep reading.
What is the different of expressing background in dBA and Noise Criteria (NC)?
The dBA number represents the overall A-weighted equivalent sound pressure level (LAeq). LAeq, overall is the total of A-weighted sound pressure levels measured in the center frequencies of the octave band over a given period of time. Here, LAeq, overall uses the same spectrum as we do in NC, which is from 63 Hz to 8,000 Hz. However, when using LAeq, overall the frequency range is more flexible. It means you can use a wider spectrum.
This weighting is used as the pattern is almost the same with the relative loudness perceived by our human ear.
Let’s get back to the measurement results in Table 1. Now, add the Leq value at each frequency with its pertinent weighting value available in Table 2. The weighted values are now in dBA, and we call this quantity as the A-weighted equivalent SPL (LAeq). Now you have eight numbers of LAeq. To turn them into one single number, you will require some knowledge of logarithm.
Table 2. A-Weighting
The idea here is that we need to sum up all the LAeq values over the frequency range. However, since we declare each value on a logarithmic scale, we need to convert it to the intensity ratio first, then turn it back into the SPL form after you finish with the summation. If you want the shortcut, you can use the below equation to calculate the LAeq, overall.

Figure 3. LAeq, overall formula
Now, let’s take the above example of measurement results as a practice. If you are not familiar with logarithm, let us guide you with the following calculation shown in Table 3.
1. Convert the value in each column to the A-weighted intensity ratio by the following formula.
Figure 4. A-weighted intensity ratio formula
2. Take the total sum of all the numbers in the third row. Here, we have 36,384.
3. Take your calculator and search the logarithm of 36,384. You must get 4.56.
4. Multiply 4.56 by 10. Now, you already that the LAeq, overall, that is 45.6 dBA.
Table 3. LAeq, overall calculation

Today you already know the difference between NC and LAeq, overall. It means you have been one step ahead in learning a more advanced thing about noise.